Possibilities for tracing and debugging can be very important when trying to find the reason for problems like the examples below:
Note: When debug is activated the performance will be
slower. Do not have it activated during normal operation.
It is recommend to read about the IFS Connect overview before you start to use the debug concept.

If an Application Server Task scheduled for background execution fails, the reason for the error will be shown
in the Schedule Application Server Tasks window.

From here it is possible to go to the Application Message window for detailed examination by choosing Show Application Message from the context menu.
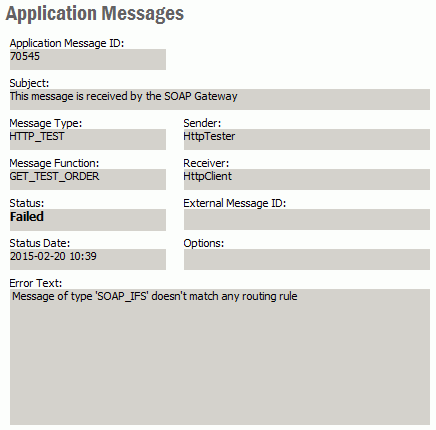
If message located on a queue has failed or is in retry mode the error will be shown like below:

IFS Connect code is using the new IFS logging framework for logging and debugging. The amount of logged information is controlled by the level of categories 'integration' and 'batchprocessor' (for the core IFS Connect parts) and 'gateway' (for SOAP Gateway).
The installation process creates Middleware Server's logging configuration file
with name j2ee-logging.properties in the directory <ifs_home>\instance\<instance_name>\conf.
By default this file creates its log files in subdirectory
j2ee of the
logging top directory
<ifs_home>\instance\<instance_name>\logs.
It creates a log file with name ifsalert.log that is
supposed to collect all error messages. There will be also an IFS Connect log
file with name ifsconnectlog.log. Logging level for this log file is set to 'info'
(read more about logging levels
here).
In the configuration files there are some commented sections that can be used as templates when enabling debugging of Connector Readers. Those sections look as follow:
handler.<handler name>.type=textfile
handler.<handler name>.filename=<path to the debug file>
handler.<handler name>.filter=ifs.fnd.log.TagFilter,<Reader Name>
handler.<handler name>.includepackage=false
IFS Connect is using the
Tag concept for marking debug messages with queue and
connector names. So simply use the connector name
as <Reader Name> to filter
messages related to the actual connector. Of course, the logging level
has to be set to debug or at least trace. Either globally or for the
‘integration’ category, if you want to exclude some statements from the framework.
For Connect Readers and Message Queues it is also possible to
change the log level at runtime, individually for each reader.
A tip: to fetch all other messages, not already handled by any of the definition according to the above description, create yet another Handler according to the following definition:
handler.others.type=textfile
handler.others.filename=<path to the debug file>
handler.others.filter=!ifs.fnd.log.TagFilter,<list of readers>
handler.others.includepackage=false
where <list of readers> is a comma separated list of connectors already handled by
the other Handlers.
Note the exclamation mark before the filter specification!
Example: This example shows how to create separate files for FILE_READER1 and MAIL_READER1, but also a third file collecting logging from all other readers:
handler.filereader1.type=textfile
handler.filereader1.filename=@IFS_HOME@/instance/@IFS_INSTANCE@/logs/j2ee/filereader1.log
handler.filereader1.filter=ifs.fnd.log.TagFilter,FILE_READER1
handler.filereader1.includepackage=false

handler.mailreader1.type=textfile
handler.mailreader1.filename=@IFS_HOME@/instance/@IFS_INSTANCE@/logs/j2ee/mailreader1.log
handler.mailreader1.filter=ifs.fnd.log.TagFilter,MAIL_READER1
handler.mailreader1.includepackage=false

handler.others.type=textfile
handler.others.filename=@IFS_HOME@/instance/@IFS_INSTANCE@/logs/j2ee/other-readers.log
handler.others.filter=!ifs.fnd.log.TagFilter,FILE_READER1,MAIL_READER1
handler.others.includepackage=false
This is also possible to use the
Tag Type concept in conjunction with the pertag directive
to automatically create separate log files for each Connect Reader or
Message Queue. Messages from Batch Processor flow are tagged by queue name and
Tag Type QUEUE. Messages from Connect Reader
framework are tagged by reader name and Tag Type READER.
Note however that all log files created this way will share the same definition.
Example: This example shows how to automatically create separate files for each reader and queue in dedicated subdirectories:
handler.queue.type=textfile
handler.queue.filename=@IFS_HOME@/instance/@IFS_INSTANCE@/logs/j2ee/message_queues/%G-@IFS_MWS_SERVER@.log
handler.queue.pertag=true
handler.queue.filter=ifs.fnd.log.TagTypeFilter,QUEUE

handler.reader.type=textfile
handler.reader.filename=@IFS_HOME@/instance/@IFS_INSTANCE@/logs/j2ee/connect_readers/%G-@IFS_MWS_SERVER@.log
handler.reader.pertag=true
handler.reader.filter=ifs.fnd.log.TagTypeFilter,READER
Logic within the Middleware Server will execute continuously in one thread only. So for better overview of debugging printouts you can use a handler definition that will split the output to separate files; one per thread:
handler.connectdebug.type=textfile
handler.connectdebug.filename=<path to the debug file>
handler.connectdebug.categories=integration,batchprocessor,gateway
handler.connectdebug.perthread=true
Middleware Server reuses threads, so one file will most probably contain more than only messages coming from one, single request. But on the other hand the request debugging will be consistent and continuous without interruptions from other threads and requests.
Separate log/debug files can be created on message queue basis using the tag
filter in a similar way as described above filtering per Connector Reader. There are already some commented
template sections for the default queues in the j2ee-logging.properties
file. There is also a commented template section that will create log files in a subdirectory
message_queues for each queue separately based on the Tag Type
concept. Example file name:
OUT1-ManagedServer1.log
Typically the log level can be changed in the j2ee-logging.properties file, which
normally requires restart of the actual server or application, or using a JMX console
(e.g. Jconsole). But there are two exceptions from this rule: log level for
Message Queues and Connect Readers can be set in runtime in IFS Solution Manager > Integration > IFS
Connect > Setup IFS Connect and will not require restart.
IFS Connect framework uses object (configuration parameter instance) names, i.e. names of readers, senders, queues and servers, as Tags, which can be used in conjunction to the TagFilter to filter logging output relevant for a particular instance.
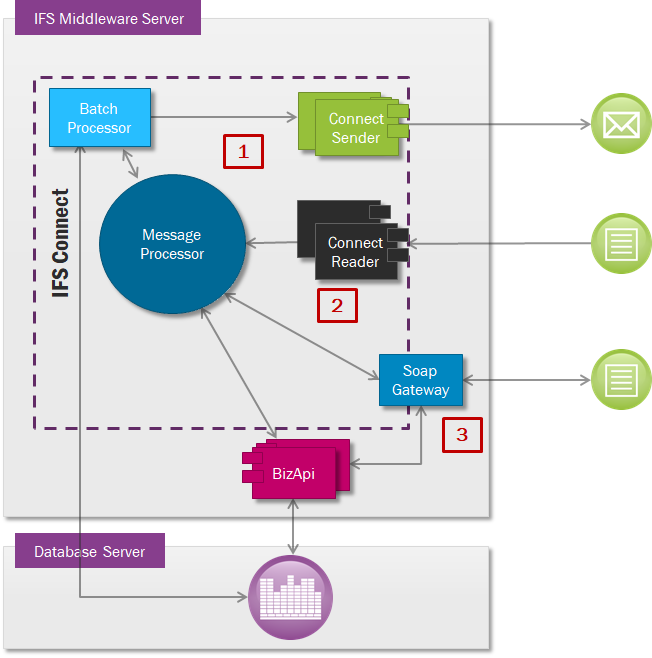
Application flow that involves
Batch Processor typically starts in the database
and end with sending a message to an external system. An error can occur in any
stage of the flow execution and may require different approach to surround the
problem. Message processing can involve following steps: